

A projection is a range, not a date
These tools show optimistic, base, and conservative scenarios side by side — with every assumption visible before you run the numbers.

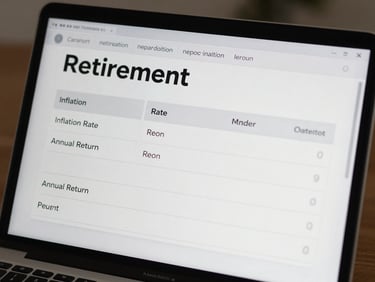
Two variables most tools bury
Inflation rate and sequence-of-returns risk sit front and center here — not tucked into a footnote. Adjust either and watch all three scenario tracks shift instantly.
The output does not tell you what will happen. It maps the territory so you know which questions to ask next.
Read the range before deciding anything
Conservative
Base
Optimistic
Lower returns, higher inflation, an early down-market year. This is the floor you plan around, not the average you hope for.
Historical average returns, moderate inflation. A reasonable midpoint — useful for comparison, not as a single answer to act on.
Strong returns, low inflation, favorable sequence. The ceiling — visible so you understand the spread, not so you plan to hit it.
No projection accounts for your tax situation, healthcare cost trajectory, Social Security timing, or how you will actually behave in a down market. These are the questions to bring to a professional.
What this tool cannot tell you
Use the output to arrive at that conversation with numbers already on the table — not to skip it.